Featured Article
ROI & Analytics
Unlocking Retail Revenue: The Power of Data-Driven Voice AI
In today's competitive retail landscape, data is king. Optimizing conversion and maximizing revenue relies heavily on insightful metrics. Voice AI, unlike traditional phone support, offers a game-changing advantage: comprehensive analytics on every single customer interaction. This blog post outlines how to measure and optimize your voice AI performance, transforming data into actionable strategies for retail success.
Strategic KPIs for Retail Executives
These are the top-level metrics that give retail leaders a clear picture of voice AI's overall impact.
1. Conversion Rate
Definition: Percentage of voice interactions resulting in a completed purchase.
Target: 15-22% (varies by product category and price point).
Benchmark: Top quartile retailers achieve 21%, while the median is 16.5%.
Calculation: Completed Orders / Total Voice Shopping Sessions
Why it Matters: Directly drives revenue and is a primary indicator of ROI. Significantly higher than web conversion (2-4%), demonstrating high purchase intent.
2. Cart Abandonment Recovery Rate
Definition: Percentage of abandoned carts successfully recovered through proactive voice outreach.
Target: 12-18%
Benchmark: Top quartile achieves 17.2%. Traditional email recovery averages only 5-8%.
Calculation: Recovered Orders / Abandoned Carts Contacted
Why it Matters: Significant revenue impact. A mid-size retailer can generate $150K-$400K annually.
3. Average Order Value (AOV)
Definition: The average dollar amount spent per voice order.
Target: Typically 15-25% higher than web AOV due to upselling and cross-selling opportunities.
Benchmark: Voice AI AOV is $87 vs. a web AOV of $72 (median).
Why it Matters: Tracks the effectiveness of product recommendations and bundle suggestions.
4. Customer Satisfaction (CSAT)
Definition: Post-purchase satisfaction rating.
Target: >88% for voice commerce.
Benchmark: Voice AI shopping boasts a 92% CSAT compared to traditional phone (76%) and web-only (82%).
Why it Matters: A strong predictor of repeat purchase behavior and customer loyalty.
5. Revenue per Call
Definition: Total voice commerce revenue divided by all voice interactions.
Target: $12-20, depending on your business model.
Benchmark: Top quartile achieves $18.50.
Why it Matters: A comprehensive revenue metric including completed orders, abandoned cart recovery, and after-hours capture.
Operational KPIs for E-commerce & Retail Managers
These metrics help retail operations managers fine-tune voice AI performance and identify areas for improvement.
1. Product Match Accuracy
Definition: Percentage of voice product searches correctly identifying the intended item.
Target: 95%+
Why it Matters: Critical for a positive customer experience. Tracks the effectiveness of NLP and catalog integration.
2. Inventory Accuracy
Definition: Percentage of voice AI inventory checks matching actual stock.
Target: 99%+ for real-time POS sync.
Why it Matters: Prevents customer frustration by ensuring accurate availability information.
3. Voice Order Completion Rate
Definition: Percentage of started voice orders successfully completed through checkout.
Target: 80-90%
Benchmark: 86% (median).
Why it Matters: Monitors checkout friction points and identifies areas for optimization.
4. Average Interaction Time
Definition: Time from voice session start to order completion.
Target: 3-5 minutes.
Benchmark: Voice AI averages 3.8 minutes, compared to 11+ minutes for traditional phone (including hold time).
Why it Matters: Measures efficiency and identifies opportunities to streamline the customer journey.
5. Transfer to Human Rate
Definition: Percentage of voice interactions requiring assistance from a human associate.
Target: 10-20%
Why it Matters: Monitors when the AI needs assistance, typically for complex products, special requests, or issues.
6. After-Hours Conversion Rate
Definition: Conversion rate for calls outside of standard business hours.
Target: 18-25%
Benchmark: 22% (median).
Why it Matters: Captures otherwise lost revenue, as customers often call with specific purchase intentions during off-peak hours.
7. Repeat Customer Rate
Definition: Percentage of voice shoppers making subsequent voice purchases.
Target: >35% within 90 days.
Why it Matters: A key indicator of loyalty and a positive customer experience.
Product & Channel KPIs
These metrics provide granular insights into product-specific performance and channel effectiveness.
Product Category Performance: Compare conversion rates by category to identify underperforming areas.
Size/Color Accuracy: For apparel/footwear, track the percentage of orders with correctly captured size and color information. Target: 97%+.
Cross-sell Success Rate: Percentage of orders including AI-recommended complementary products. Target: 15-25%.
Return Rate: Percentage of voice orders returned. Target: <10% (vs. typical retail 12-15%).
Payment Success Rate: Percentage of voice payments processed successfully on the first attempt. Target: 96%+.
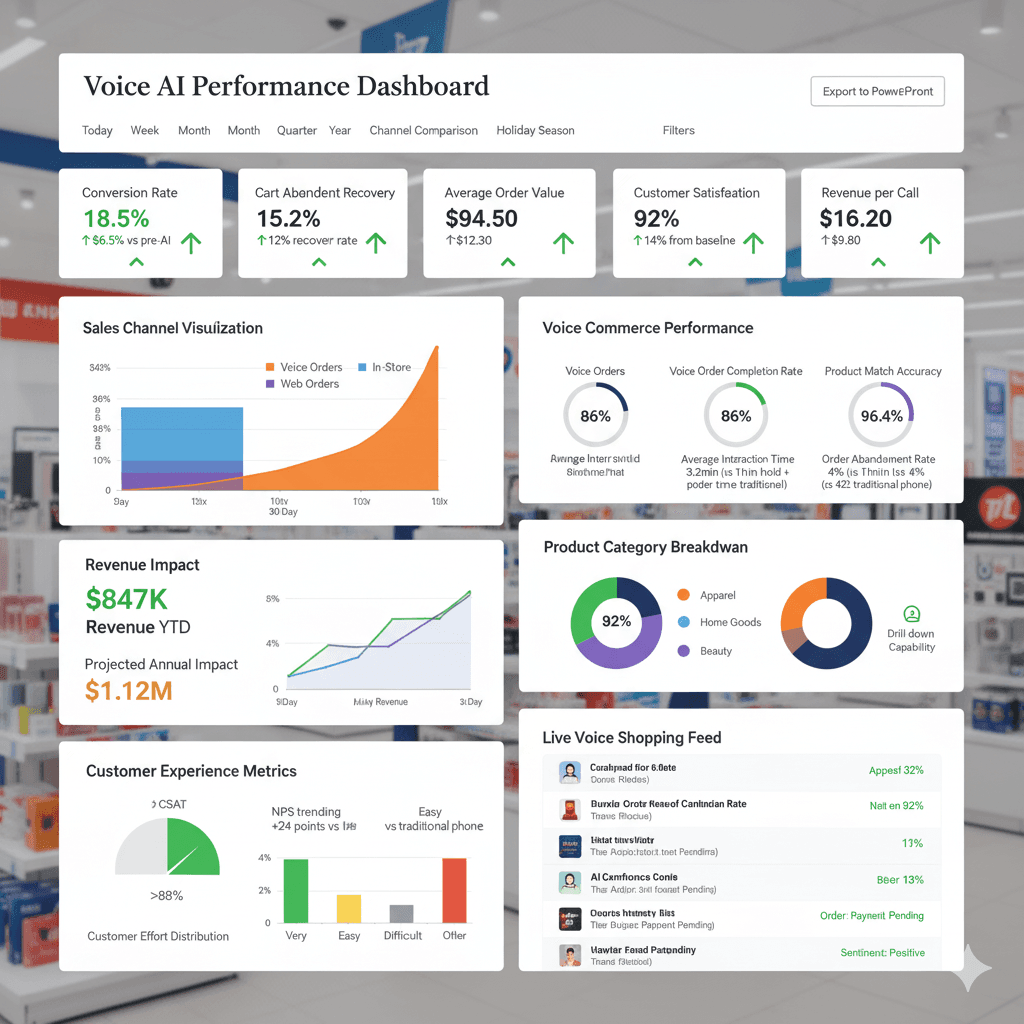
Real-Time Retail Dashboard Capabilities
A comprehensive dashboard provides real-time visibility into voice AI performance, enabling proactive management and optimization. Key features include:
Live voice shopping monitoring showing products being browsed/ordered.
Drill-down from metrics to actual conversation transcripts.
A/B testing comparison (product recommendations, voice personalities, upsell timing).
Seasonal analysis (holiday performance, back-to-school, promotional periods).
Cohort analysis (first-time vs. repeat shoppers, high-value vs. average customers).
Anomaly detection alerts (sudden conversion drop, inventory sync failure, payment processing issues).
Mobile-optimized dashboards for store managers and buyers.
E-commerce Performance Optimization Strategies
Use data insights to proactively optimize your voice AI performance. Here are some examples:
Low Conversion Rate (<12%): Analyze drop-off points, improve product matching, optimize checkout flow, test more aggressive recommendations.
Low AOV: Enhance cross-selling/upselling strategies, implement "customers also bought" recommendations, offer volume discounts via voice.
Low Cart Recovery: Optimize outreach timing, improve recovery scripts (discount offer vs. free shipping), test SMS+voice combo.
Lagging After-Hours Conversion: Analyze customer needs during these hours, ensure complete product data for popular evening items, test extended "store hours" messaging.
Retail-Specific Analytics: Beyond the Basics
Dive deep into retail-specific data to uncover valuable insights:
Product Search Query Analysis: Identify top searches (revealing demand) and failed searches (highlighting catalog gaps).
Seasonal Trends: Understand holiday shopping patterns and gift-giving occasions.
Geographic Performance: Analyze performance across different regions and store locations.
Customer Segment Analysis: Compare new vs. repeat customers, analyze age demographics via voice characteristics, and differentiate high-value from average customers.
Promotional Performance: Compare voice orders during sales vs. regular price periods.
Loyalty Program Integration: Compare conversion and AOV of loyalty program members vs. non-members.
Retail Performance Benchmarks
Understand where your voice AI performance stands relative to the competition:
90th Percentile (Exceptional): 21% Conversion, 17.5% Cart Recovery, $96 AOV, 94% CSAT, $19.50 Revenue per Call, $685K Annual Voice Revenue
75th Percentile (Strong): 18.5% Conversion, 15% Cart Recovery, $88 AOV, 92% CSAT, $16.80 Revenue per Call, $480K Annual
50th Percentile (Median): 16% Conversion, 12.5% Cart Recovery, $82 AOV, 89% CSAT, $14.20 Revenue per Call, $340K Annual
25th Percentile (Needs Improvement): 12.5% Conversion, 9% Cart Recovery, $74 AOV, 84% CSAT, $10.50 Revenue per Call, $185K Annual
Reporting Cadence and Audiences
Establish a clear reporting structure to ensure everyone is informed and aligned:
Real-time Dashboard: E-commerce managers (current conversion, active voice sessions, revenue vs. target).
Daily Morning Report: Merchandising team (yesterday's voice orders by product, trending items, inventory alerts).
Weekly Performance Review: Retail operations VPs (conversion trends, AOV movement, category performance, customer satisfaction).
Monthly Executive Summary: CEO/CFO (total voice revenue, ROI tracking, YoY growth, competitive positioning).
Quarterly Board Presentation: Strategic impact, voice channel contribution, customer acquisition cost, expansion recommendations.
About ConversAI Labs Team
ConversAI Labs specializes in AI voice agents for customer-facing businesses.