Featured Article
ROI & Analytics
Unlocking Revenue Growth: Measuring and Optimizing Voice AI Performance in Retail & E-commerce
In today's competitive retail landscape, data-driven decision-making is no longer optional; it's essential. Conversion optimization, the holy grail of e-commerce, hinges on the ability to accurately measure and analyze customer interactions. Voice AI offers a unique advantage: comprehensive analytics across 100% of customer shopping journeys, providing insights that traditional phone support simply cannot deliver. This allows for a level of understanding and optimization previously unimaginable. This blog post details the critical metrics retailers should track to maximize their voice AI investments and drive significant revenue gains.
Strategic KPIs for Retail Executives
These top-tier KPIs provide a high-level overview of your voice AI's impact on revenue and customer satisfaction.
Conversion Rate: The percentage of voice interactions that result in a completed purchase.
Target: 15-22% (varies by product category and price point)
Benchmark: Top quartile retailers achieve 21%, while the median is 16.5%
Calculation: Completed Orders / Total Voice Shopping Sessions
Why it Matters: Directly drives revenue and serves as a primary indicator of ROI. Notably higher than web conversion (2-4%), demonstrating strong purchase intent.
Cart Abandonment Recovery Rate: The percentage of abandoned carts successfully recovered through proactive voice outreach.
Target: 12-18%
Benchmark: Top quartile retailers achieve 17.2%; Traditional email recovery only yields 5-8%.
Calculation: Recovered Orders / Abandoned Carts Contacted
Revenue Impact: Can generate significant revenue, potentially $150K-400K annually for a mid-sized retailer.
Average Order Value (AOV): The average dollar amount per voice order.
Target: Typically 15-25% higher than web due to upsell/cross-sell opportunities.
Benchmark: Voice AI AOV averages $87 versus $72 for web.
Tracks: Effectiveness of product recommendations and bundle suggestions.
Customer Satisfaction (CSAT): Post-purchase satisfaction rating.
Target: >88% for voice commerce.
Benchmark: Voice AI shopping scores 92% CSAT versus traditional phone (76%) and web-only (82%).
Importance: A strong predictor of repeat purchase behavior.
Revenue per Call: Total voice commerce revenue divided by all voice interactions.
Target: $12-20 depending on business model.
Benchmark: Top quartile achieves $18.50.
Includes: Completed orders, abandoned cart recovery, and after-hours capture.
Operational KPIs for E-commerce & Retail Operations Managers
These metrics provide a more granular view of voice AI performance, allowing you to identify and address specific areas for improvement.
Product Match Accuracy: % of voice product searches correctly identifying intended item; Target: 95%+.
Inventory Accuracy: % of voice AI inventory checks matching actual stock; Target: 99%+.
Voice Order Completion Rate: % of started voice orders successfully completed; Target: 80-90%.
Average Interaction Time: Time from voice session start to order completion; Target: 3-5 minutes.
Transfer to Human Rate: % requiring associate assistance; Target: 10-20%.
After-Hours Conversion Rate: Conversion rate outside business hours; Target: 18-25%.
Repeat Customer Rate: % of voice shoppers making subsequent purchases; Target: >35% within 90 days.
Product & Channel KPIs
These metrics provide insights into specific product categories and customer behaviors within the voice channel.
Product Category Performance: Conversion by category (e.g., electronics, apparel).
Size/Color Accuracy: % of apparel/footwear orders with correct size/color; Target: 97%+.
Cross-sell Success Rate: % of orders including AI-recommended products; Target: 15-25%.
Return Rate: % of voice orders returned; Target: <10%.
Payment Success Rate: % of payments processed successfully first attempt; Target: 96%+.
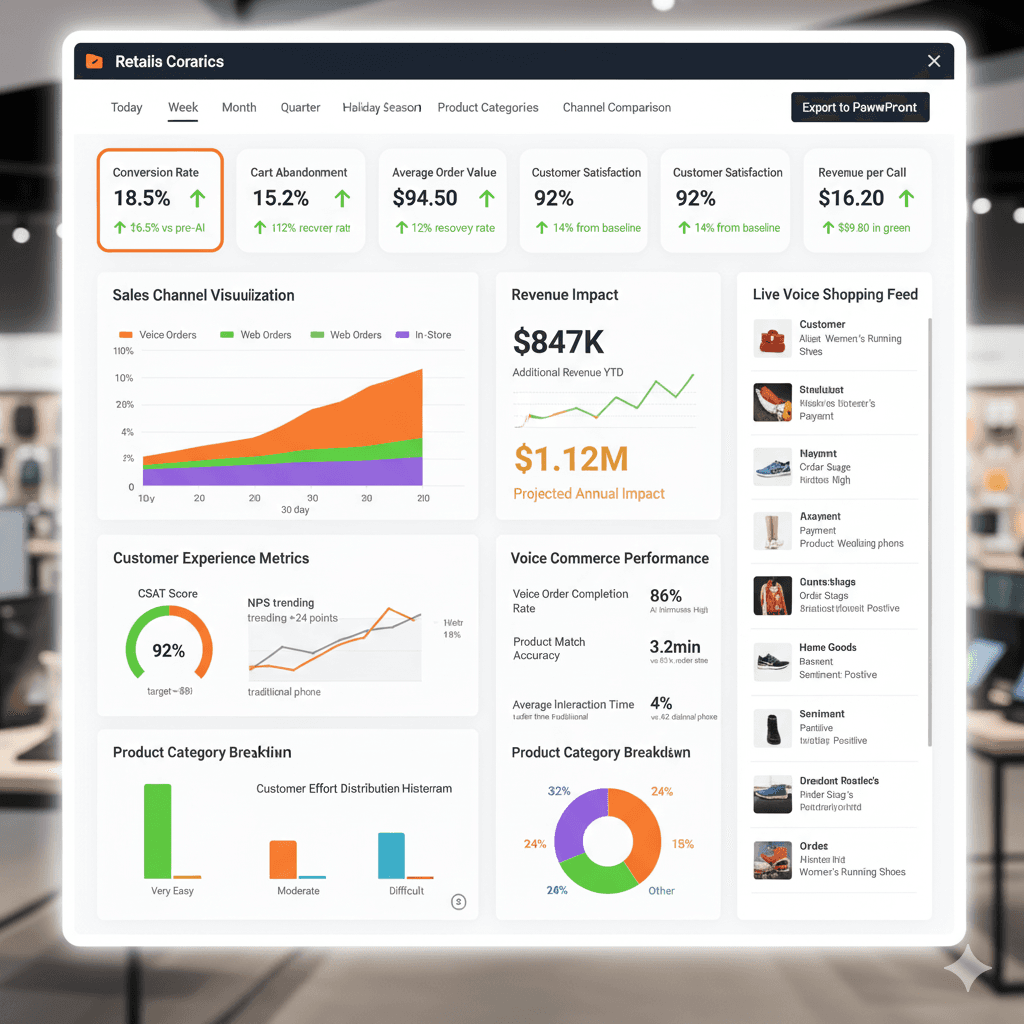
Real-Time Retail Dashboard Capabilities
A robust real-time dashboard is essential for monitoring and managing voice AI performance. Key features include:
Live voice shopping monitoring
Drill-down from metrics to conversation transcripts
A/B testing comparison
Seasonal analysis
Cohort analysis
Anomaly detection alerts
Mobile-optimized dashboards
Performance Optimization Strategies Based on E-commerce Data
Use data insights to drive targeted improvements:
Low Conversion Rate (<12%): Analyze drop-off points, improve product matching accuracy, optimize checkout flow, and test more aggressive recommendations.
AOV Below Target: Enhance cross-sell/upsell strategies, implement volume discounts via voice.
Low Cart Recovery (<10%): Optimize outreach timing, improve recovery script, test SMS+voice combo.
Lagging After-Hours Conversion: Ensure product data completeness for popular evening items, test extended "store hours" messaging.
Retail-Specific Analytics
Go beyond generic e-commerce metrics with retail-specific insights:
Product search query analysis
Seasonal trends (holiday shopping, gift-giving)
Geographic performance (regions, store locations)
Customer segment analysis (new vs. repeat, demographics)
Promotional performance (sales vs. regular price)
Loyalty program integration
Retail Performance Benchmark Tiers
Understand where your performance stands relative to industry benchmarks. Example benchmarks are provided below:
90th Percentile (Exceptional): 21% Conversion, 17.5% Cart Recovery, $96 AOV, 94% CSAT, $19.50 Revenue per call, $685K Annual Voice Revenue.
75th Percentile (Strong): 18.5% Conversion, 15% Cart Recovery, $88 AOV, 92% CSAT, $16.80 Revenue per call, $480K Annual Voice Revenue.
50th Percentile (Median): 16% Conversion, 12.5% Cart Recovery, $82 AOV, 89% CSAT, $14.20 Revenue per call, $340K Annual Voice Revenue.
25th Percentile (Needs Improvement): 12.5% Conversion, 9% Cart Recovery, $74 AOV, 84% CSAT, $10.50 Revenue per call, $185K Annual Voice Revenue.
Reporting Cadence and Audiences
Tailor reporting to specific audiences and their needs:
Real-Time Dashboard: E-commerce managers (current conversion, active sessions).
Daily Morning Report: Merchandising team (yesterday's orders, trending items).
Weekly Performance Review: Retail operations VPs (conversion trends, AOV movement).
Monthly Executive Summary: CEO/CFO (total revenue, ROI tracking).
Quarterly Board Presentation: Strategic impact, voice channel contribution.
Conclusion
By focusing on these key metrics and implementing data-driven optimization strategies, retailers can unlock the full potential of voice AI, driving significant revenue growth and enhancing the customer experience. Embrace the power of data to transform your voice commerce channel into a competitive advantage.
About ConversAI Labs Team
ConversAI Labs specializes in AI voice agents for customer-facing businesses.